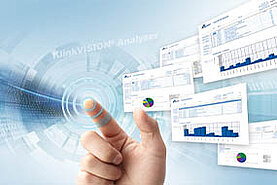
Thus you can find out at a glance which problems occur most frequently and which cause the longest downtimes. Consequential targeted measures can be taken to increase the productivity of the system. The success of the actions can be verified directly with the KlinkVISION® Analyzer. Detailed information on the alarm messages provide insight into the type of disruption, the group allocation, the relevant system section and the precise location. Meaningful descriptions indicate if, for example, the label printer is not ready, the light barrier of the conveyor is misaligned or the barcode on the container is unreadable. Weakness analysis, downtime analysis, ranking list representation, unlimited time analyses, grouping according to error categories, trend analyses and error class analyses per system section are the highlights of the evaluation.
Trends and ranking lists
The ranking list function offers the user a quick look at the alarms occurring most frequently. A trend per alarm can be displayed, showing how the disruptions spread over individual days or hours during the system runtime. The data is illustrated in pie diagrams and bar diagrams. Detailed filter settings such as date filter, group filter and text filter help to quickly identify the weaknesses. Deviations are detected early and disruptions can be avoided.
Flexible reporting
KlinkVISION® Analyzer offers the option to store and print filtered analyses directly as a report in PDF format at the touch of a button. Alarm or top messages can also be exported into an Excel file and stored for statistics purposes via Excel export. Diagrams can be stored separately as jpg or can be printed in order to process them in a management report. These functions are available at the touch of a button and provide more flexibility in the report design. You can thus prioritize your activities properly.


